This web page was produced as an assignment for Genetics 564, an undergraduate course at UW-Madison.
Homology for the Protein
|
Protein homology is generally based on protein families and the similarities between amino acid sequences, protein folding, and protein function. Many times there is a common ancestor, like in gene homologs, that results in a particular protein family. Databases like Pfam and BlastP are used to determine homologs and similarities.
|

Figure 1. A protein family with similar functions and configurations. There is high homology between these proteins. Image Credit
|
Model organisms
for the homo sapiens microtubule-associated protein tau (MAPT), transcript variant 3 protein
|
Zebrafish (Danio rerio)
Guinea Pig (Cavia porcellus)
Mouse (Mus musculus)
Rat (Rattus norvegicus)
Cat (Felis catus)
Cow (Bos tauraus)
Rhesus macaque (Macaca mulatta)
Gorilla (Gorilla gorilla gorilla)
Common chimpanzee (Pan troglodytes)
|


|
Discussion
Once again the protein is highly conserved across many species, insinuating that the protein has an important function in biological life. Based on this knowledge, research on these organisms can give scientists insight into the effect of MAPT mutations on human life as well.
Once again the protein is highly conserved across many species, insinuating that the protein has an important function in biological life. Based on this knowledge, research on these organisms can give scientists insight into the effect of MAPT mutations on human life as well.
Phylogenetic analysis of the MAPT gene
|
What is phylogeny?
Phylogeny is the study of relatedness between species, genes, or proteins. Using genomes, gene, or protein sequences, computer analysis compares the sequences and determines the similarities between them. There are multiple methods of phylogeny, each with strengths and weaknesses. Some examples of methods include Distance Matrix, Maximum Parsimony, Maximum Likelihood, and Bayesian. Although Maximum Likelihood and Bayesian use more complex computations to determine phylogeny, the general idea of relatedness can be determined using Distance Matrix, the method used in this gene's research [1]. Here the MAPT gene was analyzed with Clustal Omega W software, using eleven organisms. |
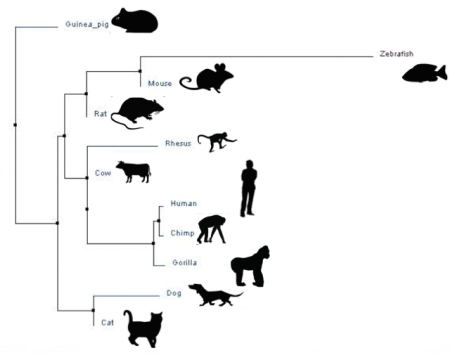
Example of Phylogenetic Tree
Figure 1. Example of a phylogenetic tree. This depcits the relatedness of the animals based on genome similarities. Phylogeny Image Credit
|

Figure 2. Image depicting a protein sequence alignment of MAPT among homologous organisms. The colors depict the similarities between amino acids at a given position in the homologous organisms.
|
Protein analysisThis protein analysis, done by ClustalOmegaW, spatially aligns the protein sequences of each organisms. It then goes through the sequences, one amino acid at a time, to determine the differences between the species. Since many species have a different number of amino acids for the same gene, there may be "breaks" in the alignment, shown by the dashes. If amino acids are conserved across all aligned species, a column with one solid color will appear in the alignment, showing complete conservation.
|
Phylogenetic analysis
Distance Matrix: In this method, all sequences are compared to every other sequence. Each difference in the amino acid sequences creates a greater "distance" between that organism and the others.
Maximum Parsimony: This method is a character-based method that determines the minimum number of character changes required to account for all sequence differences. As a whole, it minimizes the number of evolutionary steps needed to generate the amount of diversity present.
Maximum Likelihood: In this method, a more complicated calculation is used. It determines the likelihood that the data is correct, given a particular tree. This method is useful if you have knowledge about relatedness and substitutions in the given species.
Bayesian: This method calculated the probability a tree is correct, given the data. This method may seem more intuitive, but requires even more calculations than the previous method.
Even within these four methods of phylogenic analysis, there are multiple methods used to express the relatedness in terms of "distance" [1].
|
Neighbor Joining
Neighbor joining combines the closest related species in order. It starts with all organisms, and determines the species that are the most related.
|
Average Distance
Average Distance methods compare each species to every other species, and determine a "distance matrix" of relatedness.
|
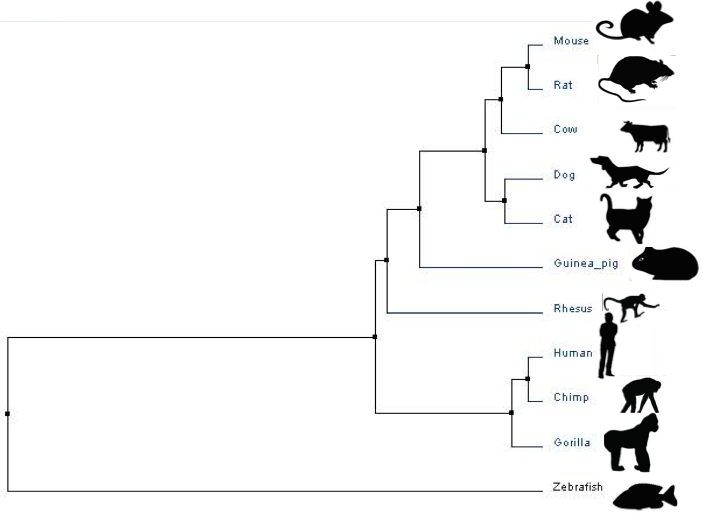
Above are trees generated using data placed into ClustalOmegaW. The trees are created using the protein sequences of each species for microtubule-associated protein tau (listed below).
The sequences used for phylogenetic analysis
Discussion
The phylogeny of MAPT shows that animals that evolved through similar pathways (and are more similar in physical and mental capabilities) have more similar sequences in the MAPT gene. The conservation of the gene through homology shows that the gene is important to biological and neural function.
The phylogeny of MAPT shows that animals that evolved through similar pathways (and are more similar in physical and mental capabilities) have more similar sequences in the MAPT gene. The conservation of the gene through homology shows that the gene is important to biological and neural function.
Image references:
[1] Guinea pig
[2] Mouse
[3] Rat
[4] Cat
[5] Cow
[6] Rhesus Macaque
[7] Gorilla gorilla gorilla
[8] Common chimpanzee
Other references
[1] Yang Z, Rannala B. Molecular phylogenetics: principles and practice. Nat Rev Genetics. 2012 March 28; 13(5):303-14. Accessed Feb. 10.
Site built by Kassandra Ford
Genetics 564, Spring 2015
University of Wisconsin-Madison
Site last updated: 5/13/2015
