This web page was produced as an assignment for Genetics 564, an undergraduate course at UW-Madison.
Measuring gene expression
GEO profiles
Various genomic techniques measure gene expression, including microarrays. After researchers obtain their data on a particular gene, it is protocol to upload data into a database such as Gene Expression Omnibus. The format of GEO profiles is a chart format, seen below. The chart shows the differential expression of the gene across several exprimental conditions. In the following example, expression of MAPT was measured across areas of the body in mice. The sections were divided into "Neural" and "Non-neural." In this example it is clear to see the differential expression between areas such as the hippocampus and the pituitary gland. One of these areas, the hippocampus, is much more involved with neural processes and would therefore is expected to be more sensitive to MAPT expression. The GEO Profile is an easy way to visually represent differential gene expression [1].
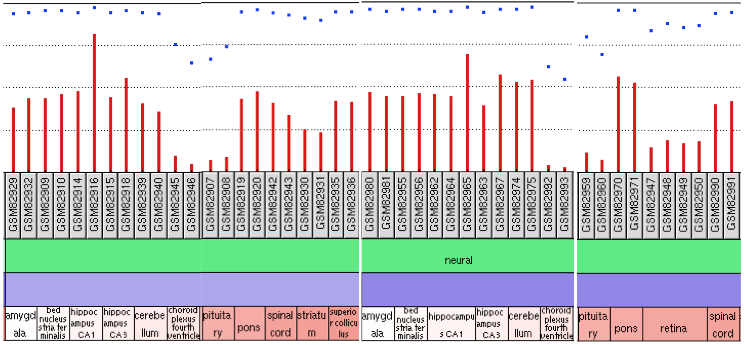
Figure 1. Depiction of GEO profile with data from various neural tissues. The expression of MAPT is compared among the various regions. Those areas associated with high neural function tend to have higher MAPT expression.
GEO datasets
GEO Datasets are the areas where the researcher's data is stored. It is not always as visually appealing or easy to understand as the GEO Profile. There are generally many genes looked at in a Dataset, so it can be difficult to sort through the data. Once the gene of interest is found, however, it can be determined if there is differential expression across areas of the organism [1]. In the Dataset below, the information portrays the same experiment as above. There are clearly areas of high and low expression levels, but it is not clear which areas are which. It requires more research to determine that the areas of high expression are the neural areas of the mice under study.
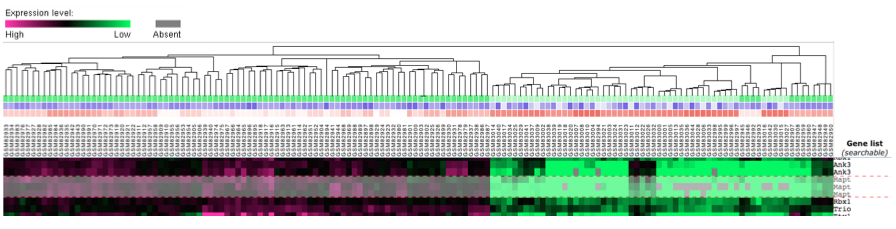
Figure 2. GEO Dataset that depicts the amount of MAPT expression in various areas of the brain.
AMIGO/GO results |
Pathway analysis |
|
After obtaining the information from the GEO Dataset, an AMIGO or GO search can be conducted on the genes nearest the one of interest under the "Gene list" area of the Dataset. About 50 genes are usually selected and similarities are found between the functions of those genes. In most Datasets, the genes listed most closely are the most related and have the most similar expression patterns [2].
The following are the AMIGO results, listed in order of the number genes associated with that particular function:
|
BioCarta is an online program used to associate genes with known pathways in the human body. At this time there are not results when the MAPT gene is entered into the database, but further searches will be conducted.
An example of a pathway is shown below. This is an example of the Cyclin gene and protein and its regulation of the cell cycle. Within the database, interactive GIFs are used to simulate the movement of cells and proteins throughout regulation. 
Figure 3. Example pathway analysis image generated by AMIGO.
Image credit |
Discussion
Although no pathways were determined, it is clear that gene expression of MAPT is highest in neural tissues. In the case of FTD research, this is important because it means MAPT could have a large impact on cell differentiation and proliferation in neural processes. With a mutation in MAPT , the amount of gene expression could be altered, therefore changing normal neural processes. More research should be completed on MAPT expression when FTD is present and absent, in order to better understand if there is a connection. Pathway analysis would be important to determine what other proteins and processes are impacted by MAPT.
Although no pathways were determined, it is clear that gene expression of MAPT is highest in neural tissues. In the case of FTD research, this is important because it means MAPT could have a large impact on cell differentiation and proliferation in neural processes. With a mutation in MAPT , the amount of gene expression could be altered, therefore changing normal neural processes. More research should be completed on MAPT expression when FTD is present and absent, in order to better understand if there is a connection. Pathway analysis would be important to determine what other proteins and processes are impacted by MAPT.
Model organisms database + RNAi mutants
How are model organisms used in research?
Model organisms, like mice, rats, zebrafish, and C. elegans are commonly used in scientific research. Although each animal has its benefits and drawbacks, the type of research being conducted makes a large impact on the model organism used. In the case of FTD, it can be beneficial to be able to see both behavioral and learning changes, along with phenotypes seen inside the brain. For these reasons, mice or rats would be a very suitable candidate for research, given their larger physical size, larger brain, and social behaviors. For my research I chose to focus on mice. All of these possible model organisms have a separate database that contains information about induced mutations or experiments being run. The Mouse Database (MGI) contains such information.
After searching for the MAPT gene on Chromosome 17 in the database, there were no results. By broadening the search to FTD, were results of many lines of mice. Several of these lines contained a mutation in the MAPT gene for the purpose of studying the FTD phenotype. These types of lines are called transgenic [3] because they are the mouse genome with a specific mutated gene (in this case MAPT) from another animal. Further research on these lines could determine if any or all of these line would be suitable for the experiments in my research.
|
One of these transgenic lines might be useful to use for the research mentioned in my Specific Aims that calls for further research on MAPT and FTD. The lines that have altered behavior and nervous systems would be of most interest to my studies. It is the hope that these lines, when used in my research, would contain FTD phenotypes like the decreased GM density shown below.

|

Figure 4. (above) A table containing the various transgenic lines of mice that contain a mutation in the MAPT gene. All lines are associated with FTD and are currently being used in scientific research.
Figure 5. (right) Images of mice with with the FTD phenotype of decreased GM density. This type of image can be generated by neuroimaging or dissection of the brain. Image credit |
Discussion
The Mouse database shows that there are several possible transgenic lines of mice that could be used for further research on FTD. If none of these lines can be used, however, it is possible to generate another line of mice with a mutation in the MAPT gene using the CRISPR-Cas9 biotechnology technique. This process can create point-specific mutations in a gene of interest using a nuclease that can cleave the DNA and alter the sequence with either a substitution, an insertion, or a deletion [4].
The Mouse database shows that there are several possible transgenic lines of mice that could be used for further research on FTD. If none of these lines can be used, however, it is possible to generate another line of mice with a mutation in the MAPT gene using the CRISPR-Cas9 biotechnology technique. This process can create point-specific mutations in a gene of interest using a nuclease that can cleave the DNA and alter the sequence with either a substitution, an insertion, or a deletion [4].
References
[1] GEO Profiling and Datasets through NCBI. Accessed 3/15/15. http://www.ncbi.nlm.nih.gov/geo/info/profiles.html
[2] AMIGO2 http://wiki.geneontology.org/index.php/AmiGO_2
[3] Wikepedia: Transgene. http://en.wikipedia.org/wiki/Transgene
[1] GEO Profiling and Datasets through NCBI. Accessed 3/15/15. http://www.ncbi.nlm.nih.gov/geo/info/profiles.html
[2] AMIGO2 http://wiki.geneontology.org/index.php/AmiGO_2
[3] Wikepedia: Transgene. http://en.wikipedia.org/wiki/Transgene
Site built by Kassandra Ford
Genetics 564, Spring 2015
University of Wisconsin-Madison
Site last updated: 5/13/2015
Genetics 564, Spring 2015
University of Wisconsin-Madison
Site last updated: 5/13/2015
